Algo
Trading Bot
We create TRADING STRATEGIES, TRADING SYSTEMS, SCREENERS and provide Technical Training to identify the HIGHEST PROBABILITY Setups in any asset class. Everything is based on PATTERN RECOGNITION, Backtesting and Forward or LIVE testing. Our Algo trading robots are software programs that execute trades on behalf of traders without human intervention. These robots can be programmed to execute a wide range of strategies, from simple to highly complex, depending on the trader's preferences and objectives.
Algo
Trading Bot
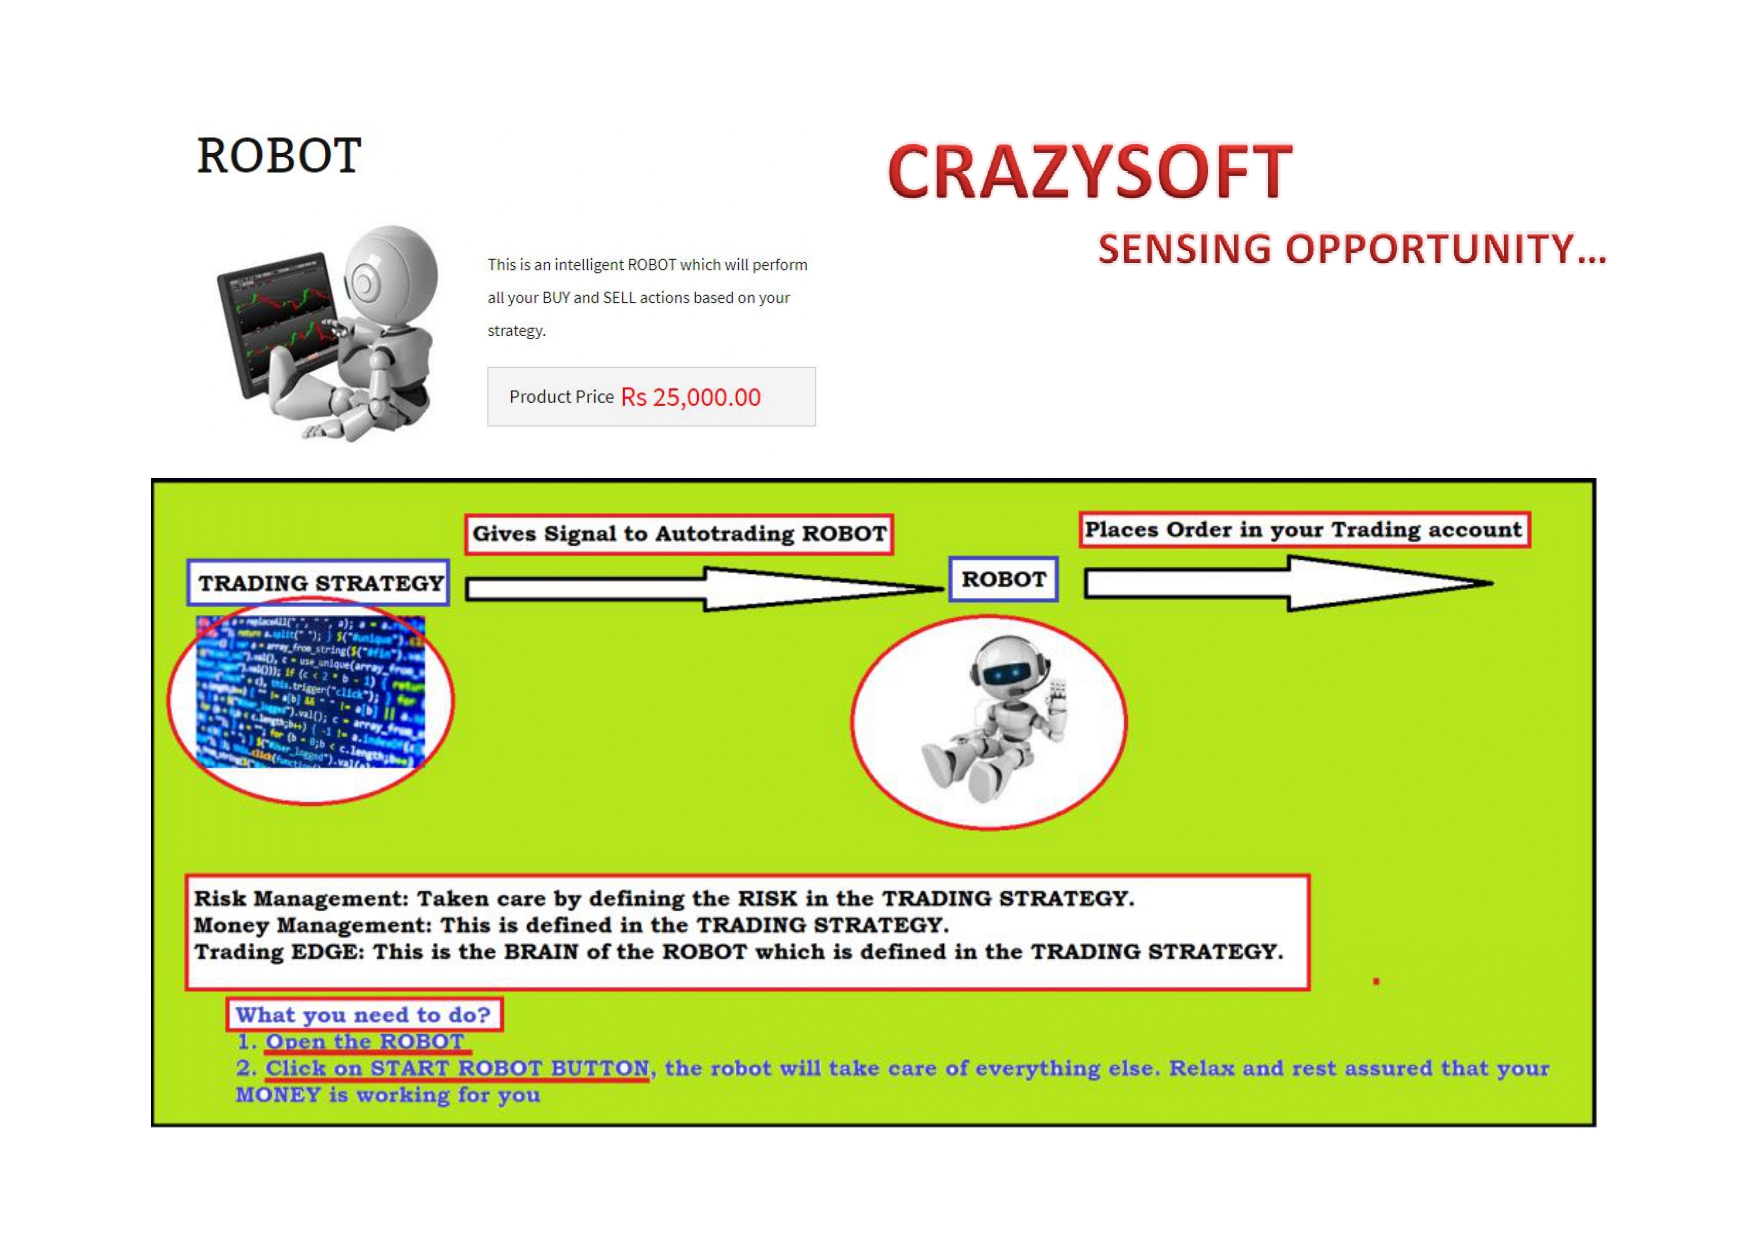
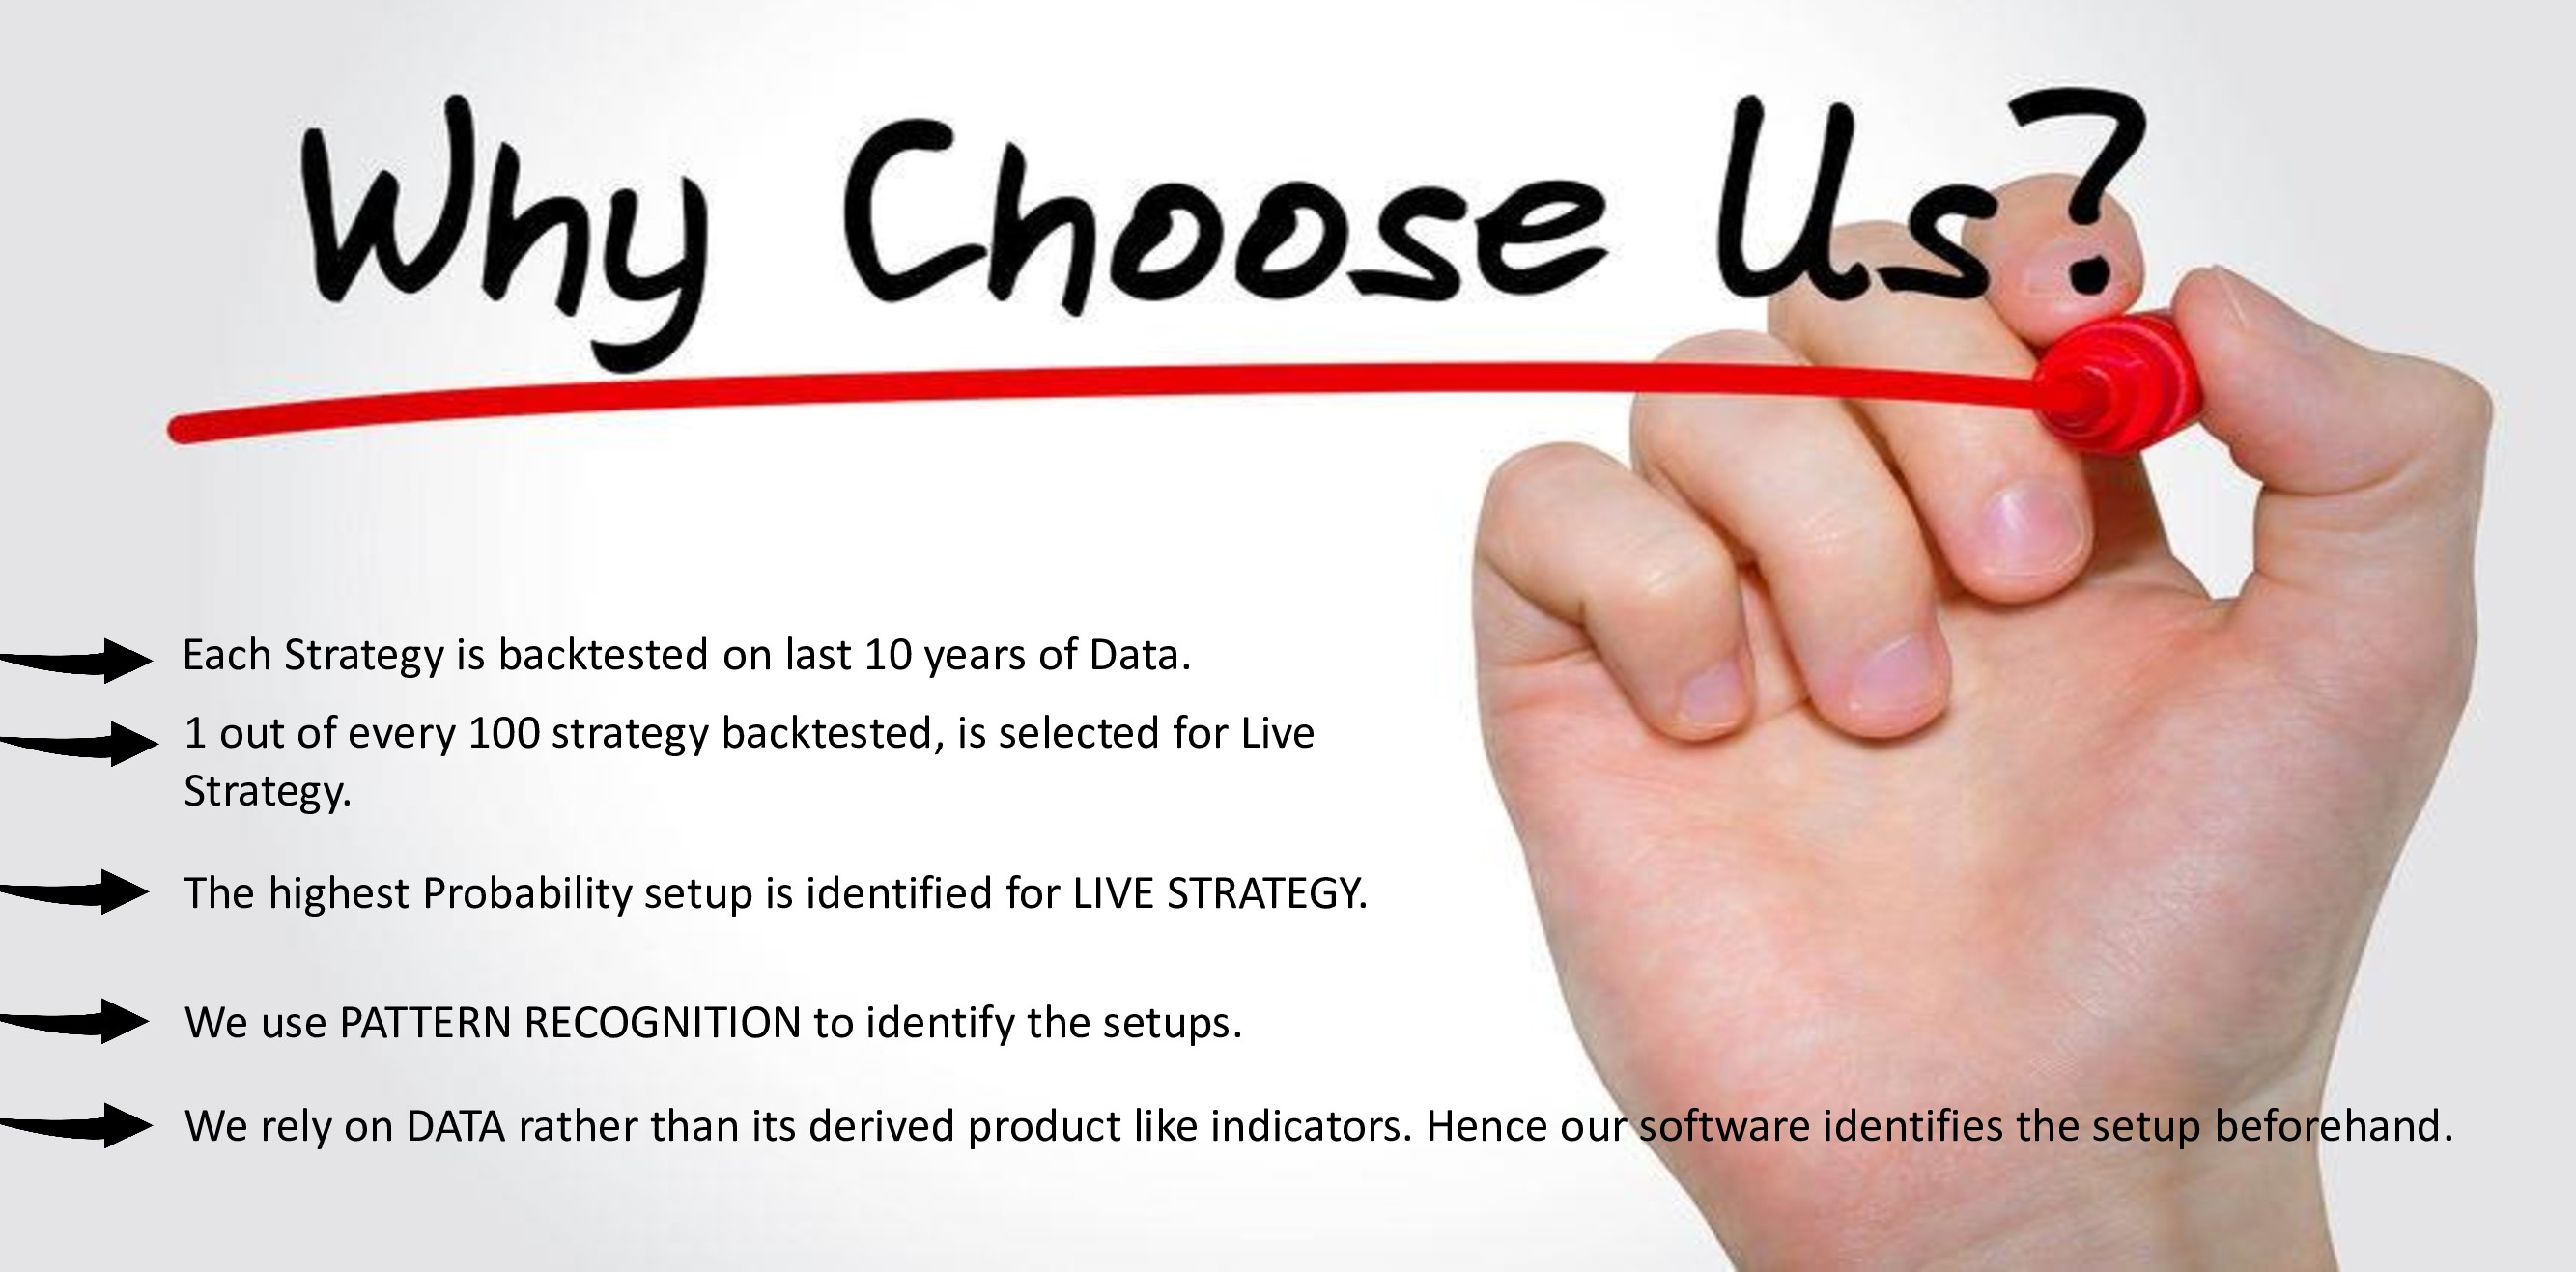
We create TRADING STRATEGIES, TRADING SYSTEMS, SCREENERS and provide Technical Training to identify the HIGHEST PROBABILITY Setups in any asset class. Everything is based on PATTERN RECOGNITION, Backtesting and Forward or LIVE testing. Our Algo trading robots are software programs that execute trades on behalf of traders without human intervention. These robots can be programmed to execute a wide range of strategies, from simple to highly complex, depending on the trader's preferences and objectives.